
Today’s post is one of those “I’m writing this so I can copy & paste it later” ones. (And yes, that cover image is a log joke and was selected to intentionally scar anyone my generation)
I’ve spent a lot of time in AWS CloudWatch today monitoring a database query log while I do some performance testing. I was looking at a long list of log entries that included a query duration as part of a JSON response in the log’s @message content.
The jsonParse function in CloudWatch allows you to query data in the JSON content. In this case, I want to sort all the queries by a duration_ms attribute greater than 0. I also want to display the duration_ms as a field in the query’s output.
Use this query:
fields @timestamp, @message, @logStream, @log, jsonParse(@message) as js
| display js.duration_ms, @timestamp, @message, @logStream, @log
| filter js.duration_ms > 0
| sort js.duration_ms desc
| limit 1000
and you get:
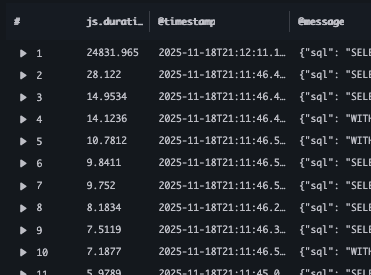
This allowed me to quickly find the slow running queries from JSON data in the log.