
The following instructions should get you up and running with the XDebug in Visual Studio Code when using the Laradock PHP development environment for Docker.
Configuring your environment
Step 1. Enable Xdebug in the Laradock .env file
Edit the .env file in your laradock folder and set both of these settings to true.
WORKSPACE_INSTALL_XDEBUG=true
PHP_FPM_INSTALL_XDEBUG=true
Step 2. Retrieve the host IP
We’ll need to tell Xdebug the IP address of the remote host. From your laradock folder, type:
netstat
The response should look something like this:
Active Internet connections
Proto Recv-Q Send-Q Local Address Foreign Address (state)
tcp4 0 0 192.168.1.129.53490 xx-fbcdn-shv-01-.https ESTABLISHED
tcp4 0 0 192.168.1.129.53488 162.125.19.131.https ESTABLISHED
tcp4 0 0 192.168.1.129.53486 162.125.11.13.https ESTABLISHED
tcp4 0 0 192.168.1.129.53485 179.178.244.35.b.https ESTABLISHED
From this, I can see my local IP address is: 129.168.1.129.
Step 3. Configure xdebug
Modify the php-fpm/xdebug.ini file in your Laradock folder with the following contents. Replace the IP address for the xdebug.remote_host setting with the IP address from step 2.

xdebug.remote_enable=1
xdebug.remote_host=192.168.1.129
xdebug.remote_port=9000
xdebug.remote_autostart=1
xdebug.remote_connect_back=0
xdebug.remote_handler=dbgp
xdebug.max_nesting_level=250
Modify the workspace/xdebug.ini file in your Laradock folder with exact same contents:
xdebug.remote_enable=1
xdebug.remote_host=192.168.1.129
xdebug.remote_port=9000
xdebug.remote_autostart=1
xdebug.remote_connect_back=0
xdebug.remote_handler=dbgp
xdebug.max_nesting_level=250
Step 4. Rebuild the PHP-FPM Container
docker-compose build php-fpm workspace
Step 5. Restart your Laradock environment
docker-compose down
docker-compose up -d nginx php-fpm workspace
Step 6. Install the PHP Debug Extension in Visual Studio Code
Add the php-debug extension by Felix Becker to your project.
Step 7. Add debug configuration to Visual Studio Code
In your VS Code project, add a .vscode/launch.json with these contents:
{
    "version": "0.2.0",
    "configurations": [

        {
            "log": true,
            "name": "XDebug listening to Laradock",
            "type": "php",
            "request": "launch",
            "port": 9000,
            "pathMappings": {
                "/var/www": "/Users/shawnhooper/work/project1",
             },
             "ignore": [
                 "**/vendor/**/*.php"
             ]
          }
        ]
}
In the pathMappings section, replace “/Users/shawnhooper/work/project1” with the path where VS Code will find your project.
Starting the PHP-FPM service
In order to use Xdebug, the first thing we’ll have to do is start the service in the PHP-FPM container.
From the laradock folder, run:
./php-fpm/xdebug start
You should see a result like this come back, showing that Xdebug is enable:
Start xDebug
14d62e482376
PHP 7.3.12 (cli) (built: Nov 22 2019 16:38:39) ( NTS )
Copyright (c) 1997-2018 The PHP Group
Zend Engine v3.3.12, Copyright (c) 1998-2018 Zend Technologies
with Zend OPcache v7.3.12, Copyright (c) 1999-2018, by Zend Technologies
with Xdebug v2.9.5, Copyright (c) 2002-2020, by Derick Rethans
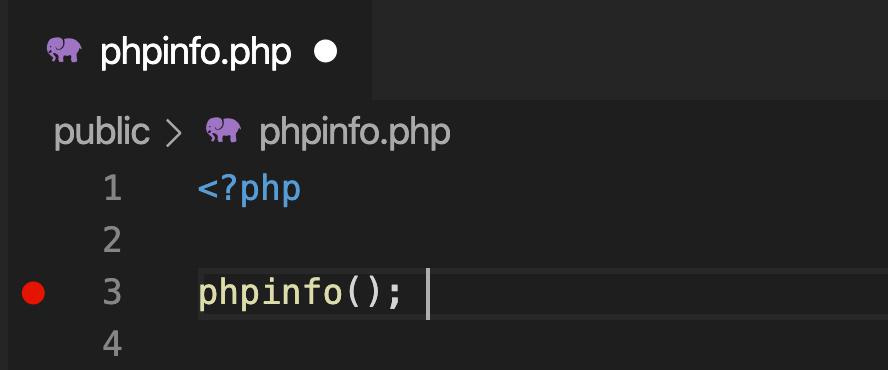
Setting a breakpoint in your code
In VSCode, set a breakpoint on where you’d like the debugging to start running. You can do this either by clicking to the left of the line number in the editor, or by pressing F9 to toggle the breakpoint on and/off.
Enabling the Listener in VS Code
To enable the listener in VS Code, click on the green “run” icon in the sidebar to display the debugger.

and then click on the Run button in the debugger’s sidebar.
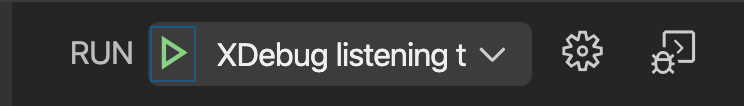
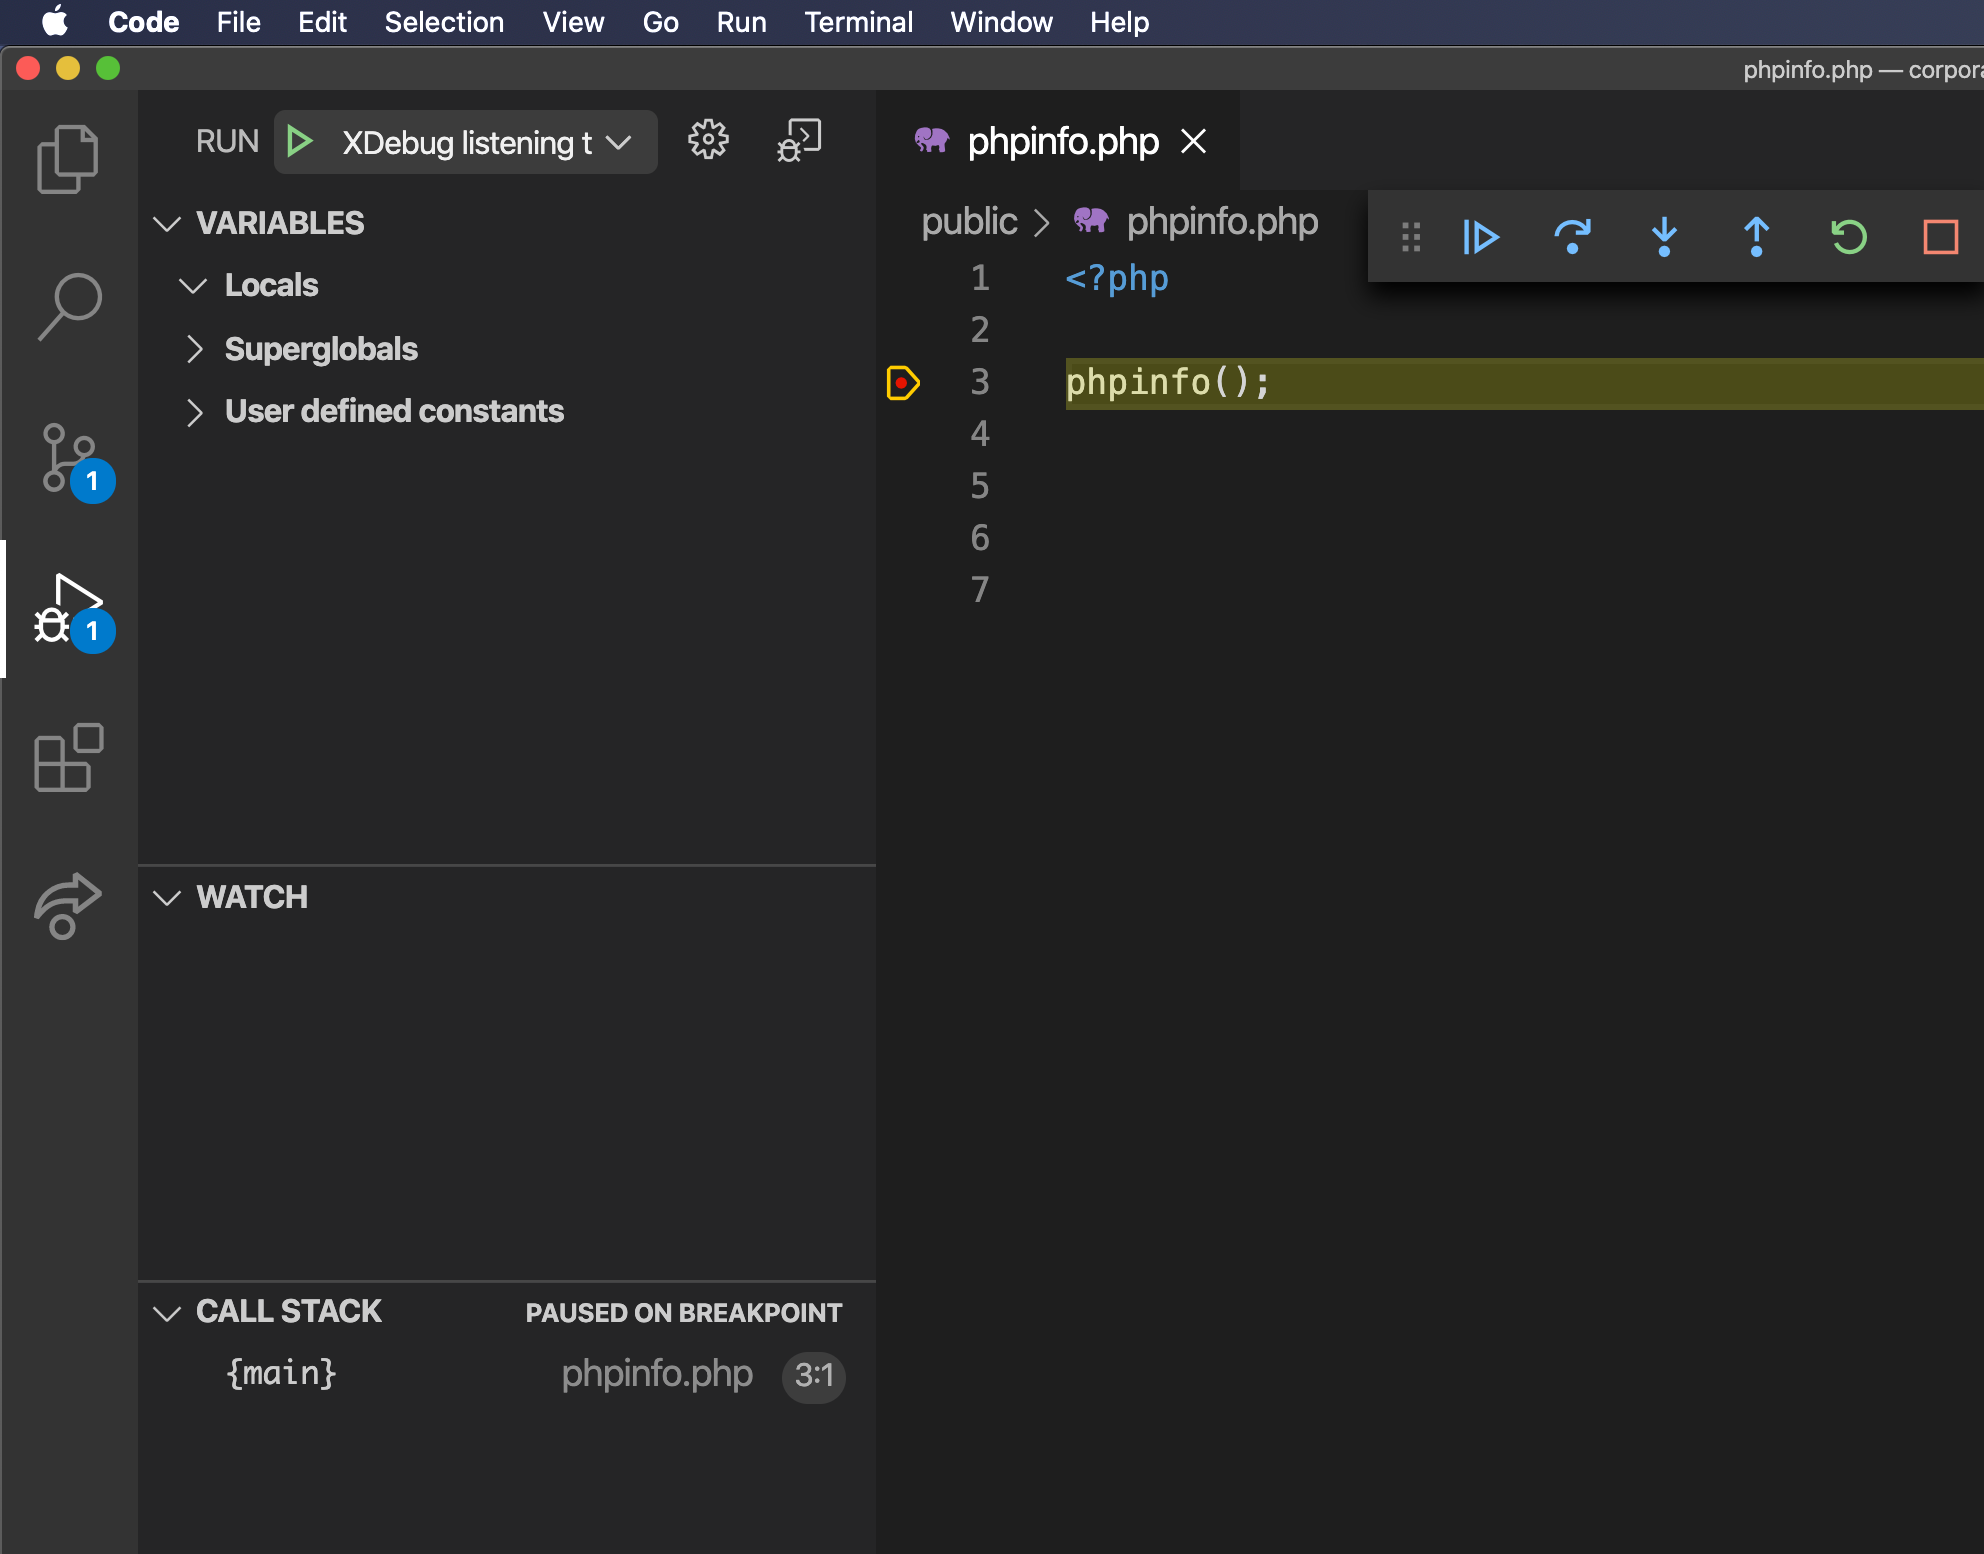
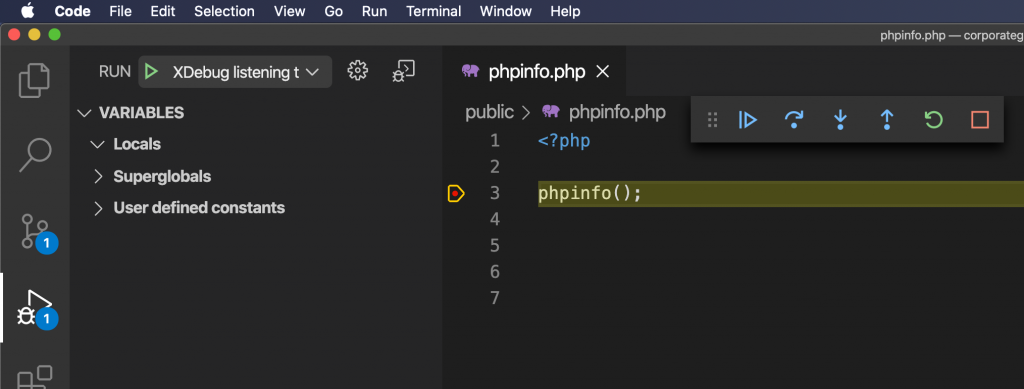
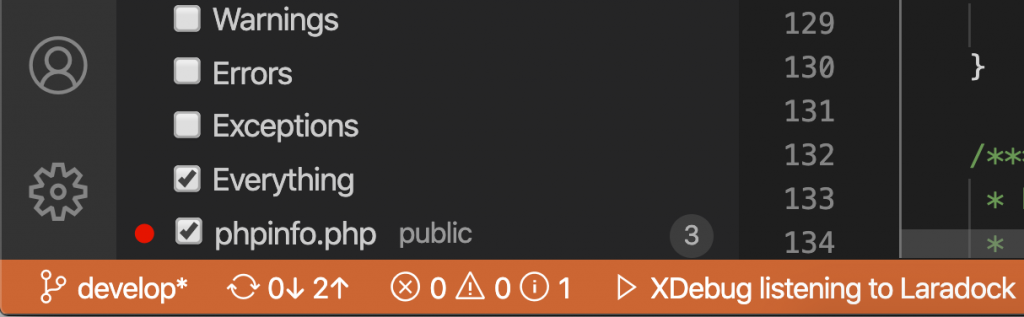
Or just press F5 to start the debugger. You should see the listener enabled in the VS Code footer. The footer will turn orange, and show “XDebug listening to Laradock”
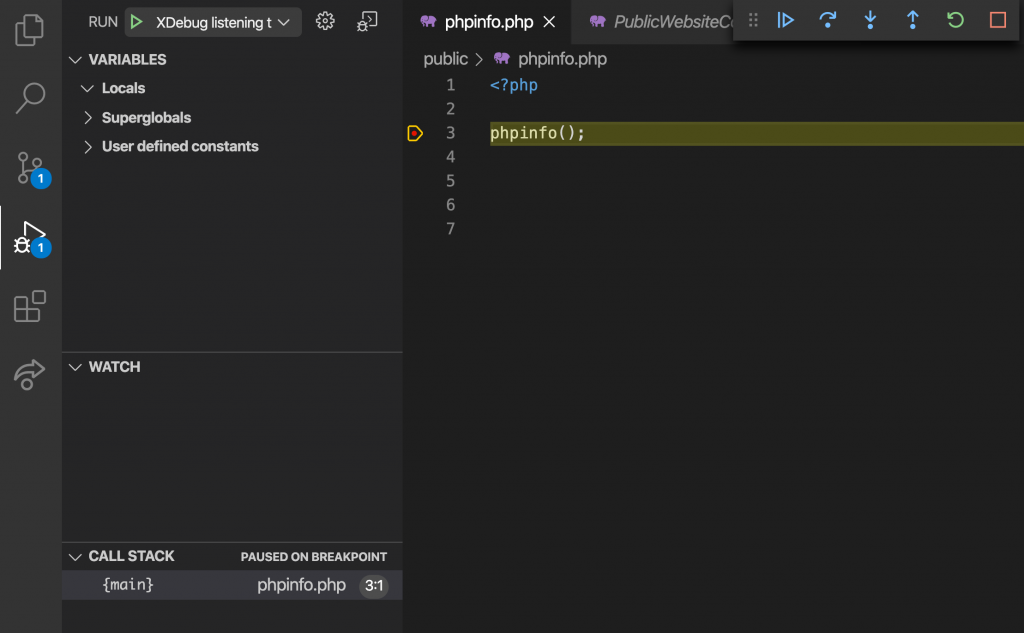
Trigger the breakpoint in your browser
Now, if I navigate in my browser to the file containing the breakpoint, the debugger will stop when it hits it.
What about if I want to trigger the breakpoint with PHPUnit on the workspace container?
Olá amigo! antes de tudo, parabéns pela iniciativa. seguir o seu tutorial, mas quando eu cheguei na parte de executar o comando:
./php-fpm/xdebug start ele me retornou a seguinte mensagem:
Start xDebug
sed: can’t read /usr/local/etc/php/conf.d/docker-php-ext-xdebug.ini: No such file or directory
2b3b3b3bdddc
PHP 7.1.31 (cli) (built: Aug 14 2019 10:13:27) ( NTS )
Copyright (c) 1997-2018 The PHP Group
Zend Engine v3.1.0, Copyright (c) 1998-2018 Zend Technologies
with Zend OPcache v7.1.31, Copyright (c) 1999-2018, by Zend Technologies
Você tem ideia do que pode ser esse problema?
You’ve got a typo at the end of ‘Step 2’ (should be 192.168.1.129), Otherwise, great guide. It’s unbelievable how hard it is to get xDebug running sometimes.